|
LIDAR Basics |
|
| Home |
USDA Forest Service, Pacific Northwest Research Station |
|
LIDAR Basics |
|
| Home |
USDA Forest Service, Pacific Northwest Research Station |
|
The FUSION/LDV
analysis and visualization software is a set of public
domain tools to help you understand and use LIDAR data.
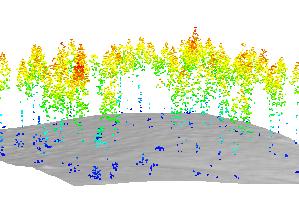
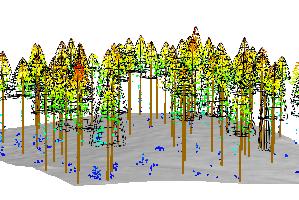
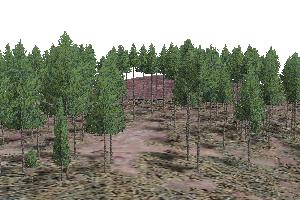
The lidar point cloud includes direct
measurements of various canopy elements including stems,
branches, and foliage. This series of images shows the
lidar data for above-ground vegetation, tree objects
inferred from the data, and a visual simulation of the
tree objects and terrain rendered with PNW Research
Station’s EnVision
software. |
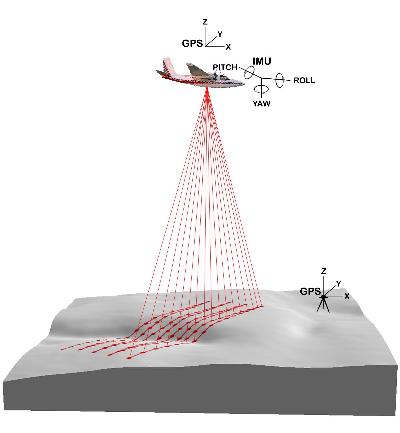
LIDAR OverviewWhat is LIDAR?Lidar uses laser light to measure distances. It is used in many ways, from estimating atmospheric aerosols by shooting a laser skyward to catching speeders in freeway traffic with a handheld laser-speed detector. Airborne laser-scanning technology is a specialized, aircraft-based type of lidar that provides extremely accurate, detailed 3-D measurements of the ground, vegetation, and buildings. Developed in just the last 20 years, one of lidar’s first commercial uses in the United States was to survey powerline corridors to identify encroaching vegetation. Additional uses include mapping landforms and coastal areas. In open, flat areas, ground contours can be recorded from an aircraft flying overhead providing accuracy within 6 inches of actual elevation. In steep, forested areas accuracy is typically in the range of 1 to 2 feet and depends on many factors, including density of canopy cover and the spacing of laser shots. The speed and accuracy of lidar made it feasible to map large areas with the kind of detail that before had only been possible with time-consuming and expensive ground survey crews. Federal agencies such as the Federal Emergency Management Administration (FEMA) and U.S. Geological Survey (USGS), along with county and state agencies, began using lidar to map the terrain in flood plains and earthquake hazard zones. The Puget Sound Lidar Consortium, an informal group of agencies, used lidar in the Puget Sound area and found previously undetected earthquake faults and large, deep-seated, old landslides. In other parts of the country, lidar was used to map highly detailed contours across large flood plains, which could be used to pinpoint areas of high risk. In some areas, entire states have been flown with lidar to produce more accurate digital terrain data for emergency planning and response. Lidar mapping of terrain uses a technique called “bareearth filtering.” Laser scan data about trees and buildings are stripped away, leaving just the bare-ground data. The VMaRS team first began their lidar research involving application in forests in 1997 to find out how much accuracy was lost in lidar flights over areas with heavy forest cover. They wanted to better understand the level of error in lidar mapping of the ground through forest canopy, to be used in analyzing terrain maps in forested areas. The team and their University of Washington collaborators found that the data thrown away by geologists were a rich source of information for foresters, a finding that has been well corroborated by lidar forestry research groups around the world. How Does LIDAR work?The use of lasers has become commonplace, from laser printers to laser surgery. In airborne-laser-mapping lidar, lasers are taken into the sky. Instruments are mounted on a single- or twin-engine plane or a helicopter. Airborne lidar technology uses four major pieces of equipment (see figureat left ). These are a laser emitter-receiver scanning unit attached to the aircraft; global positioning system (GPS) units on the aircraft and on the ground; an inertial measurement unit (IMU) attached to the scanner, which measures roll, pitch, and yaw of the aircraft; and a computer to control the system and store data. Several types of airborne lidar systems have been developed; commercial systems commonly used in forestry are discrete-return, small-footprint systems. “Small footprint” means that the laser beam diameter at ground level is typically in the range of 6 inches to 3 feet. The current generration of laser scanners send up to 1,000,000 pulses of light per second to the ground and measures how long it takes each pulse to reflect back to the unit. These times are used to compute the distance each pulse traveled from scanner to ground. The GPS and IMU units determine the precise location and attitude of the laser scanner as the pulses are emitted, and an exact coordinate is calculated for each point. The laser scanner uses an oscillating mirror or rotating prism (depending on the sensor model), so that the light pulses sweep across a swath of landscape below the aircraft. Large areas are surveyed with a series of parallel flight lines. The laser pulses used are safe for people and all living things. Because the system emits its own light, flights can be done day or night, as long as the skies are clear. Thus, with distance and location information accurately
determined, the laser pulses yield direct, 3-D
measurements of the ground surface, vegetation, roads,
and buildings. Millions of data points are recorded, so
many that lidar creates a 3-D data cloud. After the
flight, software calculates the final data points by
using the location information and laser data. Final
results are typically produced in weeks, whereas
traditional ground-based mapping methods took months or
years. The first acre of a lidar flight is expensive,
owing to the costs of the aircraft, equipment, and
personnel. But when large areas are covered, the costs
can drop to less than $1 per acre. The technology is
commercially available through a number of sources. Early Research (summary)
|
This page was last updated on June 11, 2018 by Bob McGaughey