|
UTOOLS - Landscape Analysis Software |
|
| Home |
USDA Forest Service, Pacific Northwest Research Station |
|
UTOOLS - Landscape Analysis Software |
|
| Home |
USDA Forest Service, Pacific Northwest Research Station |
Software AvailabilityThe UTOOLS package does not
operate on current versions of Windows (64-bit). It
may be possible to use the compatibility modes in
Windows to configure a command prompt that can be used
to run UTOOLS. The entire UTOOLS package consists of three files: UTOOLS1.EXE,
UTOOLS2.EXE,
and UTOOLS3.EXE.
Download all three files and put them in the same
directory. Run each executable file to extract the
program files into the directory. After extracting all
three files, you can delete the original files
(UTOOLS1.EXE, UTOOLS2.EXE, and UTOOLS3.EXE). More information is in the README file The distibution contains a detailed manual UMANUAL.DOC) describing the use of UTOOLS, example data, and a tutorial exercise designed to demonstrate many of the features of UTOOLS. |
Overview UTOOLS is geographic analysis
software developed for watershed-level planning. The
system provides a flexible framework for spatial
analyses and can be used to address a variety of
problems. The difference between UTOOLS and other
spatial analysis software packages is that in UTOOLS
all spatial data for a given project is integrated
into a single Paradox databases, where basic data
operations can be quickly and easily performed. For
instance, complex overlay operations that involve
combinations of map layers and attributes can be done
(and re-done) with simple Paradox queries. Generating
new layers from combinations of existing ones is also
easy.
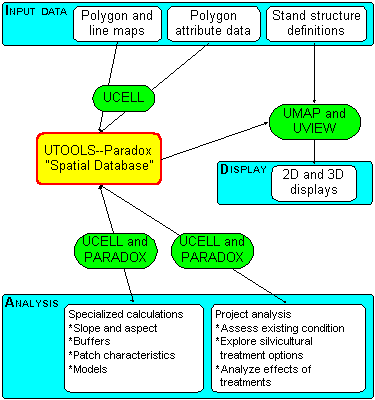 The Paradox "spatial databases" are built with several UTOOLS programs as follows:
Selected Analysis CapabilitiesSpatial databases created by UTOOLS can serve multiple analysis functions. Some example functions include:
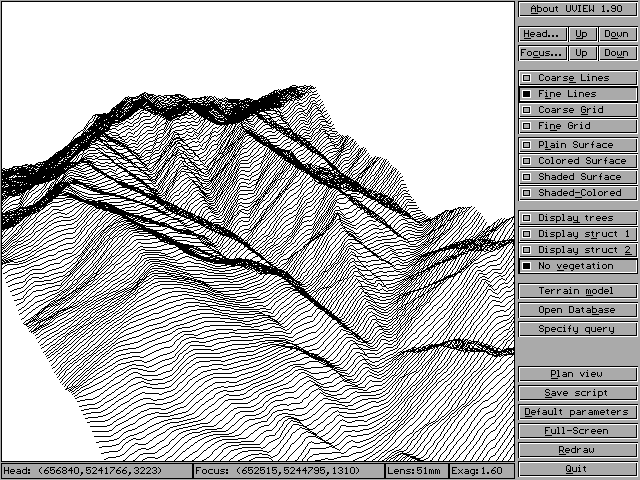
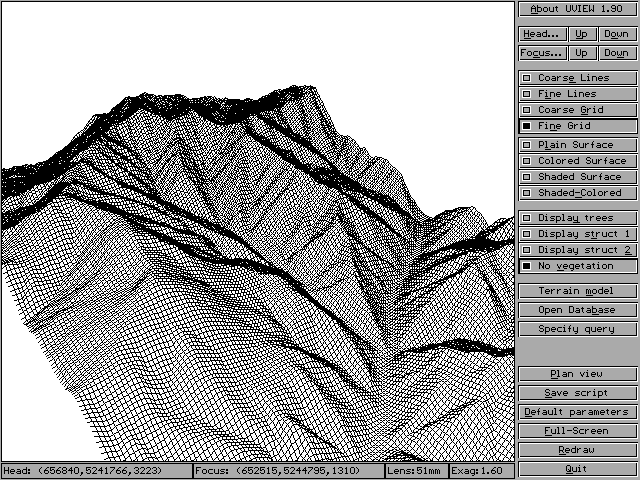
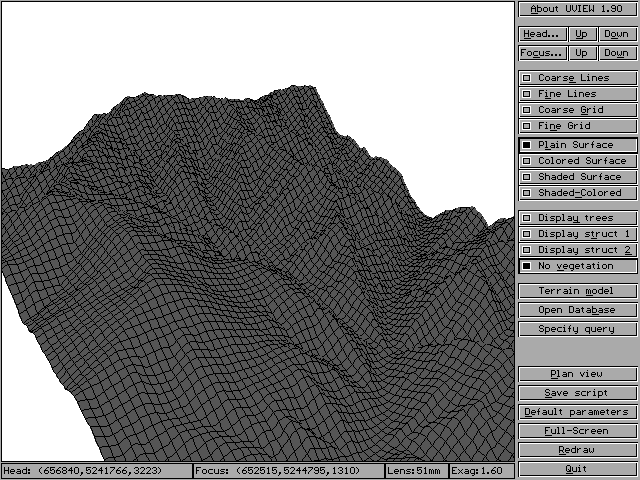
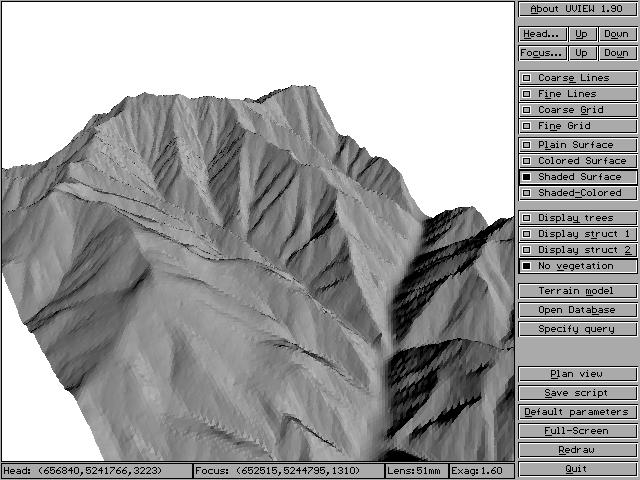
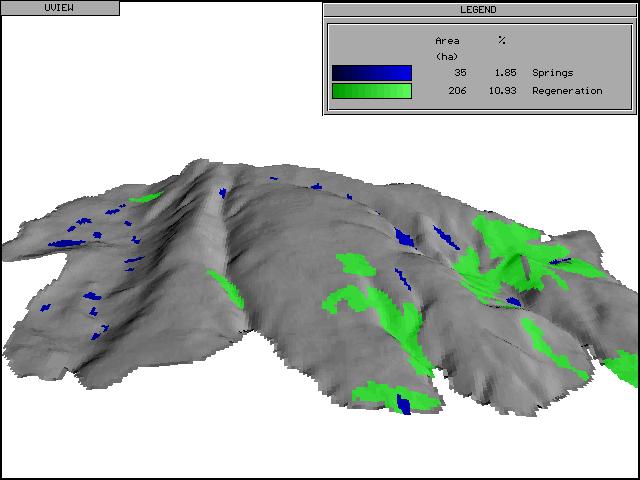
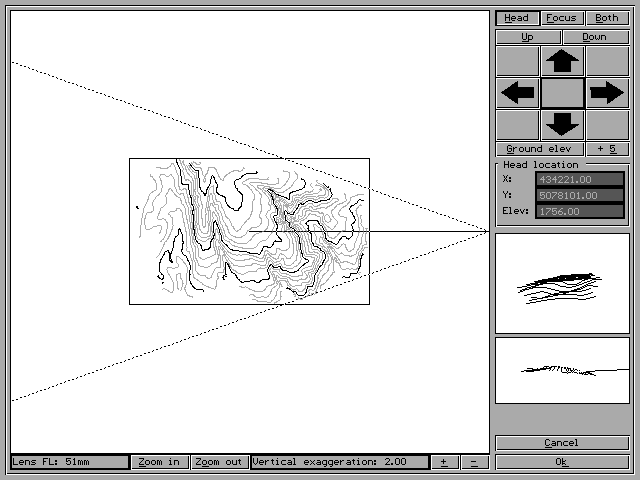
Basic Paradox Queries on Spatial DatabasesThe Paradox query commands can be used to quickly answer a wide variety of spatial questions using a spatial database. One of the most basic and useful queries on a spatial database is one that overlays GIS layers to obtain acreage reports. Acreage reports are created by first adding an ACRES field to the database using MODIFY RESTRUCTURE, and then filling it with a value equal to the pixel size in acres with a CHANGETO query. To overlay map layers and obtain acreage reports place a CHECK in the fields [map layers] of interest, and enter CALC SUM in the ACRES field. The query can be further qualified using the BLANK operator. For instance, to exclude all area outside of old growth stands, add NOT BLANK in the old growth field. Additional queries are demonstrated in the tutorial included with UTOOLS.Simulating Effects of Project AlternativesParadox queries can be used to examine the effects of alternatives on other resources. For instance, suppose it is desired to analyse and map the effects of harvest treatments on elk habitat. A spatial database is created that includes fields for proposed treatment areas for each alternative, and a field containing cover values for the existing [pre treatment] condition. The fields for the proposed alternatives are created by rastering individual map layers with treatment areas represented as polygons. Using MODIFY-RESTRUCTURE command in Paradox, fields are added for predicted cover data for each alternative. These fields are then filled with the cover data for the existing condition using a CHANGETO command in a query. A query is then run that checks the prescriptions for each alternative and changes the cover based on the prescription. Here, a cover reduction of 100% might be assumed for group selection prescriptions, while a reduction of 20% might be assumed for an overstory removal prescription. Once the cover data is calculated for each alternative, these data can be used to generate fields containing elk habitat cover values, which are in turn exported to input files for the elk habitat software [HEICALC, HEIWEST].The predicted canopy data for each alternative can also be used in UVIEW to create landscape images that depict changes to the landscape from each proposed treatment. Treatment units will appear in the UVIEW landscape scene if UVIEW is told to use cover data created above for each alternative. A variety of other "simulations" can be performed using similar methods. For instance, the effects of treatments on late/old landscape structure can be examined using the DISPLAY or FRAGSTATS program. Fire and other catastrophic effects can also be simulated and visualized by applying various rule-based queries in Paradox that modify vegetation structure in the spatial database. These can be visualized with UVIEW by creating vegetation structure databases that essentially tell UVIEW to draw snags or "sick" trees where particular disturbances are present. UVIEW Visualization ToolUVIEW is a public domain software package developed by Robert J. McGaughey of the U.S. Forest Service, Pacific Northwest Research Station as part of UTOOLS. UVIEW is a display system designed to produce two- and three-dimensional images of digital terrain models (DTM), attribute data stored in PARADOX spatial databases, and vegetation patterns at landscape scales. UVIEW combines the capabilities of a relational database with a simple terrain viewing system to provide a flexible analysis and display tool. Images produced by UVIEW provide a readily understood visualization depicting existing or desired landscape conditions.UVIEW provides a flexible system for viewing a digital terrain model (an organized data set describing the ground surface consisting of a regularly spaced grid of elevations). Four parameters control the appearance of perspective views:
 UVIEW renders a DTM using a variety of methods and resolutions:
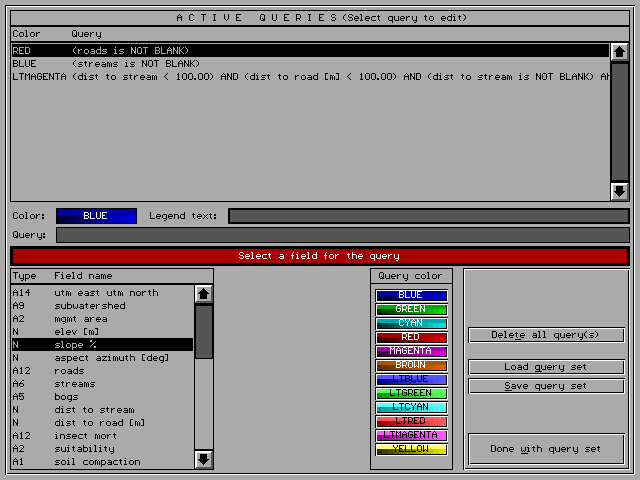
UVIEW supports interactive query development to specify combinations of database attributes for display on solid surface representations. The query system supports a variety of query operators including string pattern matching, numeric comparisons, and boolean operators. Twelve colors are available to differentiate between queries. UVIEW uses solid colors in 16-color graphics modes and gradients from dark to light in 256-color graphics modes. The actual color used to display a cell matching a query is selected based on the amount of light from the simulated light source striking the cell. UVIEW can display query results in both perspective and plan views.
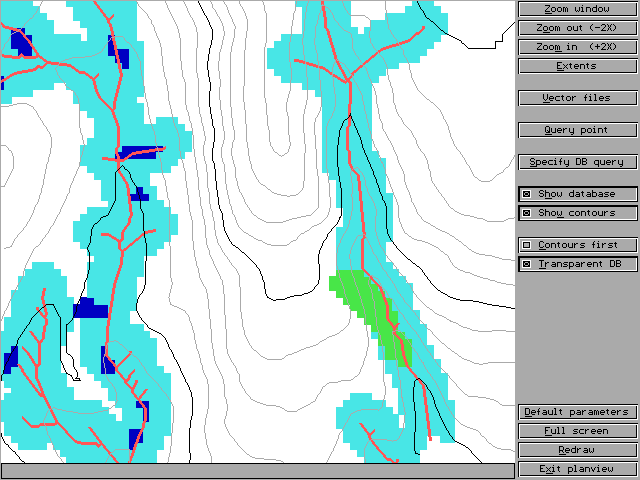
UVIEW can display a plan view of the DTM, represented as contour lines, along with attribute data from PARADOX databases. UVIEW generates contour lines from the DTM using a user specified contour interval. Database attributes are displayed using the query system described above. UVIEW can display polygon and vector data files on plan view displays.
UVIEW supports a script language to facilitate generating sequences of images. Sequences can represent a landscape from different viewpoints or changing landscape conditions from a single viewpoint. UVIEW includes a simple utility, VIEWPCX, to display sequences of PCX images at a rate of about 1 frame per second. Commercial or shareware utilities are available to combine the image files, stored in PCX or TARGA formats, to provide high-speed animation capabilities. UVIEW scripts can also generate images with no user interaction providing a simple method of reproduce a standard set of images depicting alternative management scenarios. UVIEW models vegetation patterns to simulate existing
or desired landscape conditions. The primary goal in the
vegetation modeling is to simulate overall landscape
texture and pattern rather than specific, detailed
vegetation structure. UVIEW uses two methods to model
vegetation patterns. The first method uses estimates of
canopy closure contained in the PARADOX spatial database
to generate tree cover for each pixel. The second method
relies on vegetation codes contained in the PARADOX
spatial database and a second database containing
structure definitions for each possible vegetation code.
Canopy closure based vegetation modeling represents
vegetation patterns over an entire landscape. The canopy
closure method represents differences in stand densities
well but does not represent differences in stand
composition and structure. UVIEW represents all values
of canopy closure using the same type and size of plant;
only the density of plants varies. Vegetation modeling
based on structure definitions represents both stand
density and stand composition. Stand structure
definitions consist of layer descriptions with each
layer in a vegetation type described by the type of
plant, plant stem diameter, plant height, plant crown
diameter, plant live crown ratio, a factor describing
the variability of the size parameters, and the number
of plants per unit area (normally acres or hectares).
UVIEW represents a variety of plant types ranging from
grass to mature, healthy conifer and hardwood trees.
Vegetation structure descriptions can consist of up to
36 layers. Practical descriptions contain 2 to 3 layers. 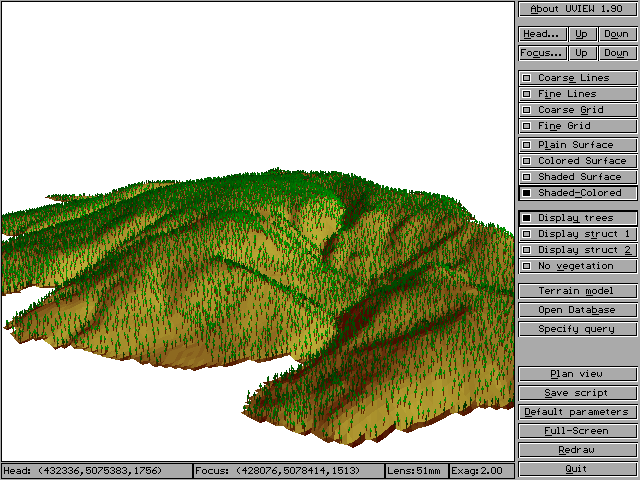 Hardware and Software RequirementsThe UTOOLS programs can be run with the example data on any IBM compatible computer equipped with a EGA/VGA monitor, 2 Mb RAM, DOS 3.0 or later, and 10-20 MB of free hard drive space. At least 560 kb of conventional memory must be available. Larger configurations are necessary for efficient operational use, due to the size of spatial databases and the requirements of Paradox to process them. We typically use a 486/33 with 200 mb of available hard drive for 30,000 - 50,000 acre projects. A backup storage device such as an IOMEGA Bernoulli drive is also useful for sharing databases among machines. A mouse is useful for UVIEW and, to a lesser extent, UMAP.Paradox is not required to run the UTOOLS programs. However, without Paradox it is not possible to perform many basic operations on the spatial databases created by the UTOOLS programs. UTOOLS programs are compatible with all Paradox 4.0 and 4.5 for DOS, and all Paradox for Windows. UTOOLS programs will generally run from within a DOS window in WINDOWS. One exception to this is UVIEW running in 256 color SVGA mode. Data RequirementsUTOOLS requires polygon and line data in the MOSS export (ASCII) format. Data must use the UTM (Universal Transverse Mercator) coordinate system. A version of UTOOLS that operates with the state plane coordinate system is being tested. The MOSS export format can be generated from vector maps stored in MOSS using the MOSS command: EXPORT or the ARC-INFO command: ARCMOSS. Polygon and line data can be intersected with project boundaries prior to processing with the UCELL5 program to isolate the area of interest from larger map layers (e.g. forest-wide, or merged quads encompassing the project area). This step can be accomplished with the OVERLAY program. This step is not always necessary since pixels outside of a project can be deleted with a Paradox query after the database is built. There also is an option within the UCELL5 program to use a polygon or line layer as a database template. With this option, only pixels with a user-specified distance of the template layer are retained in the project. For most projects, one of the above two methods (intersect before UCELL, or use the UCELL template feature) should be used to avoid creating large databases covering areas that are not of interest. |
This page was last updated on June 11, 2018 by Bob McGaughey